KollectAll V8! User Screens
On these pages you will find detailed information on what and how to use a K8! screen.
Some are tab driven and other launch automatically in response to a mouse click.
Exporting your Data to MicroSoft Excel
Exporting your database is a great way to use the power of Excel to create complex reports and graphs. The following steps will show you how to export you data to excel. If you do not own Microsoft Excel you will need to purchase a copy if you are going to export your database to MS Excel.
The first thing you need to do is export your database, to do this start KollectAll V8! and click on the "File" tool option at the top of the program screen and then click on "Backup".

After you click on "Backup" the windows "Save As" window pop's up. You will need to save your database to a place on you computer where you will remember you saved the database file, we suggest you save it to your "My Documents" windows folder but you can save it anywhere you want.

Once you have decided where you are saving your database, you need to name it, use any name you will remember by typing it in the "File name" windows at the bottom of the "Save as" pop up window and click on "Save". Your database is now saved and can be imported into Microsoft Excel.

A pop up confirmation windows appears confirming you saved the database, click on "Ok" to continue.

Now you need to start Microsoft Excel, once Excel starts, click on "File" and then "Open" navigate your windows folders until you find your save database. Double click on your saved database and the following window will open. Select the "Items" line item to open the items folder. Microsoft Excel is very powerful, it is impossible for us to teach you all the powerful tools Excel has in it, the following information only briefly shows you a few things you can do. If you are going to buy and use Excel we highly recommend that you also purchase one of the "Excel for Dummies" books as it is an excellent resource.

Edit the opened spread sheet information to show what you want.

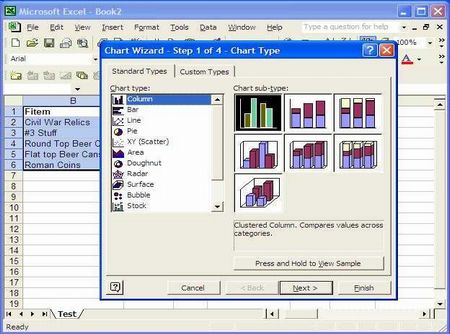
From here you can print out reports or make a graph, in the illustration below we will show you a quick report graph. Highlight the data you want to create a graph on.

Next click on the graphs tool in the top tool bar in Excel. The chart tool in Excel pop's up that allows you to create a custom graphical report.

Create the graphical report chart you want and print it out, email it or whatever you want to do with it.

That's it, using the power of Excel allows you to create and manage complex graphs and databases, it is a simple process to export your data to Excel and then with a little knowledge on how to use Excel make complex reports and graphs.
|